Consumer Market Monitor Q2 2018
- Date: Fri, Aug 24, 2018
Share this article
Brexit negatively affects new car sales in Ireland
- Imported second hand cars doubled in two years up to 100,000 from 50,000 in 2015
- Imports likely to overtake new car sales of 120,000 next year if trend continues
The latest Consumer Market Monitor (CMM), published today by the Marketing Institute of Ireland and UCD Michael Smurfit Graduate Business School has revealed that the number of imported second-hand cars has doubled in two years up to 100,000 from 50,000 in 2015. Sales of new cars were down by 10.5% in 2017, a trend which is continuing into 2018, with sales down 4.9% in the first half of the year.
Professor Mary Lambkin of UCD Michael Smurfit Graduate Business School said: “Two-thirds of items on supermarket shelves are imported and that percentage is even higher for clothing and household goods. However, despite our reliance on a high proportion of imports for many types of goods, fears of Brexit have not materialised yet in most consumer sectors, except for car sales. Car sales are the one sector in which Brexit has had a clear and dramatic effect, driven by the significant fall in the value of sterling which has made car imports cheaper. While this is beneficial to the consumer, it is damaging Irish car dealerships,” she added.
Consumer spending is growing at a steady pace and continues to be one of the main drivers of economic growth in Ireland, along with construction. Growth continued in both sectors in 2017 and this pattern is continuing in 2018. Consumer spending was up 3% for 2017 in current terms, while construction grew by 4.2%. Both retail and services, which make up the bulk of consumer spending, are up by an average of more than 4% annually, which is, in turn, driving strong vat returns which are up 5.5% this year so far.
Tom Trainor, Chief Executive of the Marketing Institute of Ireland said “The increasing number of people employed, together with increases in hours worked and, to a lesser extent, pay increases, have led to a substantial increase in disposable income and contributed to growth in consumer spending”.
General Summary
Consumer spending is growing at a steady pace and continues to be one of the main drivers of economic growth in Ireland, along with construction. Growth continued in both sectors in 2017 and this pattern is continuing in 2018. Consumer spending was up 3% for 2017 in current terms, while construction grew by an even higher 4.2%.
Consumer spending is projected to increase by 4% this year in current terms, equal to 2.6% in real terms. This pattern is also expected to continue through 2019 with a growth of 4% in current terms or 2.5% in real terms.
The main drivers of this growth are population expansion, along with increasing employment. Employment growth has averaged 3% every year since 2012. Employment is forecast to increase by a further 2.6% this year, followed by 1.9% in 2019. There are now 2.2 million people at work, up 48,000 year-on-year, and up by 344,000 (+19%) from the low point in 2012.
The increasing numbers of people employed, as well as increases in hours worked, is leading to a substantial increase in the amount of disposable income circulating in the economy. There has been a remarkable increase in gross disposable income -- it has increased up by about 5% a year in each of the past three years. In sum, it reached €102 billion in 2017, eclipsing the 2008 peak of €101 billion. Disposable income is continuing to grow in 2018, at about the same rate of 5%, and this is expected to continue in 2019.
Pay increases have also contributed to the rise in disposable income but by a smaller amount. Pay rates were up by around 2% per annum for the past three years. Increases of about 3% are forecast for this year and a similar rate for 2019. Households across the economic spectrum are now starting to gain from strong employment and wage growth.
Consumer confidence is also very strong here at present, and significantly higher than in the UK and the rest of Europe. It fell a little bit in recent months reflecting concerns about global risk factors and higher fuel costs, but it remains largely positive.
Retail sales were strong in 2017, up by 4.3% in volume and by 2% in value, following a growth of 3% in volume in 2016 with value static. All retail categories performed well with household goods growing by double digits and out-performing all other categories.
Sales of new cars are one important exception showing significant weakness, down by 10.5% in 2017 for a total of 127,045. New car sales are continuing to be weak this year, down 4.9% in the first half for a total of 83,037.
In contrast, there was a dramatic increase in the number of imported second-hand cars, up 47% in 2016 and up the same again in 2017, to a total of 92,508. This growth is continuing in 2018, up 12% in the first half year suggesting a total of more than 100,000 for the year.
Sales of services are also strong, up by 4% a year for the last three years. Vat returns were correspondingly strong, up by 7.1% for 2017, and by a further 5.5% for the first half of 2018.
Services sectors such as accommodation and food and information/communications have grown by double digits in recent years. Others such as wholesale and transport have had mixed fortunes, possibly influenced by the bad weather early in the year.
Residential property is the sector under most pressure, as is well known. There were 50,000 homes sold in 2017, up by 11% on 2016, despite an acute shortage of supply -- just 18,900 properties were for sale in December 2017, or 1% of the national housing stock of 2 million homes. This strong demand is continuing in 2018, with 60,000 sales expected for the year.
Consumer Confidence
Consumer confidence has been recovering in Ireland since 2013, reaching a record high in June 2015. At that point, it was well ahead of the last peak in 2007 and significantly higher than our European neighbours.
Confidence fell slightly through 2016, reflecting uncertainty about Brexit and industrial unrest. It picked up again in 2017, however, and ended the year on a high level, well above the EU average.
Consumer confidence is remaining strong in 2018 although there has been a slight weakening in recent months. The current level is still consistent with a growing economy, with increasing employment and economic benefits expanding across the country.
Consumer confidence in the UK has been negative since Q2 2016 due to worries about Brexit as well as general political uncertainty. Confidence declined steadily through 2017, reaching a low of -8 in December. In contrast, consumer confidence has improved across the rest of the EU, reflecting strengthening economies.
Consumer Incomes and Spending
The disposable income of Irish households rose by 5% in 2017 to a total of €102 billion, eclipsing the last peak of €101 million experienced in 2007. Increasing numbers in employment was the main driver of the increase in disposable income, with pay increases contributing slightly also. Lower fuel prices and a weakening in the value of Sterling also boosted disposable income.
Personal consumption, of which household spending is over 90%, closely mirrors income, increasing from €62bn to €95bn (+48%) from 2002 to 2008. Spending then declined for five years, a reduction of -15% in current terms and -7.5% in real terms.
Personal spending began to recover in 2014, up 2%, and up 4.5% in 2015. It continued to grow in 2016, up 4% in real terms and was up 3% in 2017 to €100 billion, of which households accounted for €94 billion.
Consumer spending is continuing to grow this year, with forecasts suggesting that spending will be up by 2.6% for 2018, and by 2.5% for 2019.
Consumer Borrowing
Borrowing by Irish households grew at a record level from 2000 and peaked in March 2008 at €150 billion, but declined steadily from there, down 40% to €86 billion by Q1 2017. The trend finally reversed in 2017 with debt increasing by 2%, the first sign of a return to normal conditions. Total household borrowing stood at €88.5 billion in Q1 2018.
Loans for house purchase, which account for 84% of household borrowing, peaked in Q1 2008 at €124 billion but dropped to a low of €73 Billion by Q4 2016, a cumulative decline of 40%. Mortgage lending has begun to increase again since then, up to €75 billion by the end of 2017, an annual growth of 5%. 72,489 (10%) of accounts were still in arrears at the end of 2017.
Lending for other consumption accounts for 18% of total borrowing. This category peaked in Q1 2008 at €30 billion but declined to €12 billion by December 2016, a reduction of 60%. It resumed growth in 2016 and grew by 5% in 2017 to €13.5 billion.
Overall, the ratio of household debt to disposable income has fallen by 60%, from a peak of 215% in mid-2011 to 140% in Q3 2017. Despite this improvement, however, Irish households are still the fourth most indebted in the EU.
Residential Property
Residential property is the sector under most pressure and this has been the case ever since the economy started to recover. There were 45,342 homes sold in 2016 which was lower than the 47,313 sold in 2015 in a situation of very short supply.
Sales strengthened in 2017, up 10% to 50,000, the highest rate of sales since the recession. This was despite a lack of stock; there were just 18,900 properties for sale in December 2017 or 1% of the national housing stock of 2 million homes.
This upward sales trend is continuing in 2018, with 20,000 sales transactions in the first five months, and 60,000 sales expected for the year. This will be assisted by the increase in new homes being built, estimated at 20,000 this year, up 58% from 2015.
Services
The services sector recovered more quickly from the recession than the retail sector, showing modest growth from 2011 onwards, and overtaking the 2007 peak in 2014.
The services index grew by 4-5% per annum on average for the past four years, including 2017.
Growth accelerated in Q2 2018 to 9.3% year-on-year, a considerable lift. Vat returns were also up more than expected, by 5.5% for the first half of the year.
The fortunes of individual service sectors have varied considerably over recent years; for Q2 2018 year-on-year: accommodation and food service are up 12.5%, wholesaling (+12.9%), administrative and support services (+19.8%), information and communication (+15.5%), transportation/storage (+11.2%), professional/ technical services flat (-0.8%), while other services fell (-14.8%).
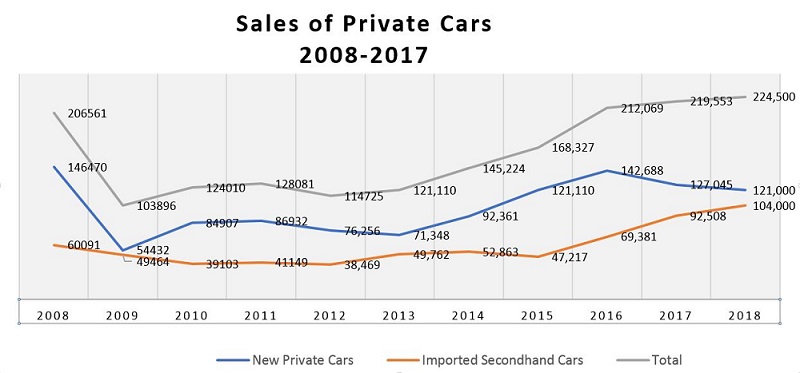
Car Sales
Car sales began to recover in 2014, with sales of 92,361, a 30% increase, and this rate of growth continued in 2015 with 121,110 sold. Sales continued upwards in 2016, with 142,688 cars sold, a slightly lower growth rate of 18%.
New car sales were weaker in 2017, down 10.5% year-on-year, for a total of 127,045. 83,037 new cars were sold in the first half of 2018, down 4.9% year-on-year, suggesting a figure of 138,000 for the year.
In contrast, there was a dramatic rise in the number of imported second-hand cars, up by 47% in 2016, and by a further 46% in 2017 to a total of 92,508. This reflects the weakening of sterling which made imports better value.
Imported used cars are continuing to increase in the first half of 2018, up 11.9% to 50,272, suggesting a total of more than 100,000 for the year.
Retail Spending
Retail sales were strong in 2017, up 4.3% for the year in volume terms, and up 2% in value. Growth accelerated as the year progressed, to a level of 7% in Q4, summing to annual spending of €40 billion which is back to the levels seen in the last boom. Vat returns were also very strong, up by 7% in 2017 for a total of €13 billion.
Retail sales excluding the motor trade grew by 4.5% in volume in H1 2018 and by 3% in value, year-on-year. Household equipment continued to be the fastest growing category, up 9.7% in volume and 3% in value. Supermarkets and other food stores also performed well, and newsagents enjoyed a lift of 5.8% in volume and 6.7% in value, a positive boost after several years of negative figures.
- Food sales up 4.9% in volume and up 3.3% in value;
- Non-specialised stores (supermarkets) up 5.6% in volume and 4.1% in value;
- Fuel up 1.6% in volume and 6% in value;
- Clothing, footwear & textiles up 2.3% in volume and 0.5% in value;
- Household equipment up 9.7% in volume and 3% in value;
- Department stores up 4.2% in volume and 1% in value;
- Pharmaceuticals and cosmetics up 5.9% in volume and 1.2% in value;
- Bar sales up 1.1% in volume and up 3% in value;
- Books, newspapers, stationery up 5.8% in volume and 6.7% in value.
Discover our Rankings and Accreditations