Consumer Market Monitor Report, 1st Quarter 2018
- Date: Mon, May 21, 2018
Share this article
Despite the rebound in Irish consumer spending, professional and technical services still lag 13% behind 2007 peak
- Spending on services up by 4% in 2017 and again in Q1 2018
- Professional and technical services including architecture and engineering still 13% below last peak in 2007
The latest Consumer Market Monitor (CMM), published today by the Marketing Institute of Ireland and UCD Michael Smurfit Graduate Business School, has shown that by the end of 2017, the services index was up by 15% over the 2007 peak, with most service sub-sectors recording growth for the past year. The only exception is professional and technical services, including architecture and engineering, which are still 13% lower than the last peak in 2007.
“Professional services showed the most dramatic boom and bust cycle. In particular, architecture and engineering firms, which were inextricably tied to the fortunes of construction, suffered significantly in the economic downturn. And while this sub-sector has been growing back steadily in recent years, it is still 13% lower than the peak level of 2007. In spite of an estimated 19,000 new homes built in Ireland last year, house building in Ireland is still among the lowest in Europe, and this has impacted the growth of this sub-sector.” said Professor Mary Lambkin of UCD Michael Smurfit Graduate Business School, author of the report.
Sales of residential properties strengthened in 2017 up 7% to 51,688, the highest level since the recession. Transactions are up by a further 5% in the first months of 2018, suggesting a final figure of about 55,000 for the year. There has also been an increase in the number of new homes being built, an estimated 19,000 were built last year, and that is expected to increase to 21,000 in 2018.
“All of the economic fundamentals in the Irish economy remain strong with continuing growth in employment and modest wage increases being the primary drivers of growth. The services sector, which covers a range of businesses from banks to hotels, is responsible for the employment of hundreds of thousands of people in Ireland and it is very encouraging to see strong growth within the sector, up 15% from the peak in 2007.” said Tom Trainor, Chief Executive of the Marketing Institute of Ireland.
Services
The services sector recovered more quickly from the recent recession than the retail sector, showing modest growth from 2011 onwards. The services index overtook the 2007 peak in 2014, and made further gains in 2015 and 2016, up by 5% per annum. By the end of 2017, the services index was up by 15% over the 2007 peak, representing healthy growth.
Growth slowed slightly in 2017, to a rate of 4%, but picked up towards the end of the year. Growth of 8% was experienced in January of this year, but this fell back to 2% in February and March, probably because of the exceptionally bad weather.
Most service sub-sectors have recorded growth for the past year, and again in quarter 1 2018, suggesting a positive picture for the rest of the year. Service sub-sectors grew as follows in 2017: Professional, Scientific and Technical (+11.9%), Administrative Support (+8.5%), Wholesale and Retail (+5.2%), Accommodation and Food Service (+3.2%), Weaker sectors were: Transportation and Storage (+1.6%) and Information and Communication (+1.9%).
The chart below shows, however, that there has been considerable variation in the recovery paths of different service sectors over the past ten years. Information and communication which include mobile phone and internet services have grown in a straight line upwards and are now 60% higher than a decade ago, although this sector slowed in 2017.
Accommodation and food services have done next best, growing rapidly from 2014 to 2016, but levelling off a bit since then. This seems surprising in view of the growth in tourism over these years but may reflect capacity constraints in Dublin. However, the 2017 index is 30% up on 2008 which is a strong performance.
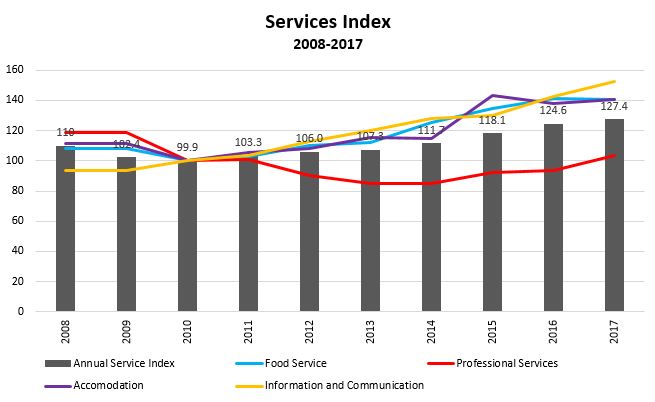
Professional services showed the most dramatic boom and bust cycle. This includes such things as architecture and engineering which were tied to the fortunes of construction, as well as advertising, and legal and accounting services, all of which suffered significantly in the economic downturn. This sub-sector has been growing back steadily in recent years but is still 13% lower than the peak level of 2007.
General Summary
Consumer spending is back to levels last seen a decade ago at the height of the boom. Total spending reached €100 billion in 2017, about the same as 2007. Spending has been growing strongly for the past three years and continues to be one of the main drivers of economic growth, along with investment in construction. Consumer spending was up 2.8% last year, while construction up by an even higher rate of 4.2%.
Consumer and investment spending are continuing to grow strongly in 2018 and 2019 with overall domestic demand projected to grow by 4.9% over the period. Personal consumer spending is forecast to grow by 2.9% in 2018 and by 2.5% in 2019.
The main factors supporting growth are population expansion, along with increasing employment. There are now 2.2 million people at work, up 61,300 year-on-year, and up by 344,000 or 19% from the low point in 2012. Growth of 2.4% is forecast for 2018 and 2.0% for 2019 which would bring another 99,000 people into the workforce.
The increasing numbers of people employed is leading to a substantial expansion in the amount of disposable income circulating in the economy. Disposable income has increased by about 5% a year in each of the past three years. In sum, it reached €102 billion in 2017, eclipsing the 2008 peak of €101 billion. Disposable income is expected to continue growing in 2018 and 2019, at about the same rate of 5% per annum.
Pay increases have also contributed to the rise in disposable income, but by a smaller amount. Pay rates were up by around 2% per annum for the past three years and increases of about 3% are forecast for this year and next. Households across the economic spectrum are now starting to gain from strong employment and wage growth.
Consumer confidence is also very strong here at present, and significantly higher than in the UK and the rest of Europe. It fell slightly in the second half of 2016 due to worries about Brexit but was back in positive territory throughout 2017 and is remaining steady so far this year.
Retail sales were strong in 2017, up 4.3% for the year in volume terms, and 2% in value. Growth accelerated as the year progressed, to a level of 7% in Q4, suggesting strong momentum into 2018. Vat returns were also very strong, up by 7% in 2017.
The exceptionally bad weather conditions in Q1 of this year dampened spending but despite this, retail sales grew by 4.3% in volume by 2% in value, year-on-year. Prospects of renewed momentum seem positive for the rest of the year. Sales of new cars are one important exception; sales were down by 11% in 2017, for a total of 127,045. This trend is persisting in 2018 with new car sales down -3.9% in the first quarter for a total of 58,402.
In contrast, there has been a dramatic increase in the number of imported second hand cars, up 47% in 2016 and 46% in 2017 for a total of 92,508. Imports are up by a further 8.1% in the first quarter of 2018, suggesting a total of 100,000 for the year, a new record. This reflects the weakening of sterling making imports better value.
Residential property is the sector under most pressure, as is well known. Sales strengthened to 51,688 in 2017, up 7%, the highest rate of sales since the recession. Transactions are up again in the first three months of this year, by about 5%, suggesting a final figure of about 55,000 for the year.
Consumer Confidence
Consumer confidence in Ireland has been recovering since 2013, reaching a record high in June 2015. It fell slightly through 2016, reflecting uncertainly about Brexit and industrial unrest at home.
Confidence picked up again in 2017 in response to strong employment data and has remained steady into Q1 of this year. The current high level is a response to the growing economy, the benefits of which are being felt by greater numbers of people.
Consumer confidence in the UK has been negative since Q2 2016 due to worries about Brexit as well as political uncertainty. Confidence remained muted through 2017 but gained 3 points in Q1 of this year. In contrast, consumer confidence has improved across the EU, becoming positive in Q1 2018 (+0.3) compared with -6.4 in Q4 2016.
Consumer Incomes and Spending
The disposable income of Irish households rose by 5% in 2017 to a total of €102 billion, eclipsing the last peak of €101 million experienced in 2007. Increasing numbers in employment was the main driver of the increase in disposable income, with pay increases contributing slightly also. Lower fuel prices and a weakening in the value of Sterling also boosted disposable income.
There are now 2.2 million people at work, up 48,000 for the year, and up 344,000 from 2012. Pay increases of 2% were common in 2015 and 2016; this rose to 3% in 2017 and looks to be similar this year.
Total personal consumption reached €100 billion in 2017, up 3.2% in current terms on 2016. This is a bit less than the growth rate of the two previous years, which averaged 3.8% per annum.
Household spending, which accounts for about 94% of all personal spending, closely mirrors income. It began to pick up in 2014, increased by 4.5% in 2015, by 3.5% in 2016, and by 3.2% in 2017. Forecasts indicate a similar rate of growth in 2018 and 2019.
Consumer Borrowing
Borrowing by Irish households grew at a record level from 2000 and peaked in March 2008 at €150 billion, but declined steadily since then, down 40% to €86 billion in Q4 2016 or €30,199 per capita. Household debt turned a corner in 2017, growing by 2%, the first sign of a return to normal conditions.
Loans for house purchase, which account for 84% of household loans, peaked in Q1 2008 at €124 billion, but fell to a low of €73 Billion by Q4 2016, a decline of 40%. Mortgage lending has begun to increase again since then, up by €4 billion by end 2017, an annual growth of 5%. A total of 70,488 accounts (10%) were in arrears at end-December 2017.
Lending for other consumption accounts for approximately 18% of total borrowing. This category peaked in Q1 2008 at €30 billion but dropped to €12 billion by December 2016, a reduction of 60%. This category resumed growth in mid-2016 and grew by a very significant 5% in 2017.
Overall, the ratio of household debt to disposable income has fallen by 60% from a peak of 215% in mid-2011, down more than any other EU country. This ratio stood at 140% in Q3 2017, which leaves Irish households still the fourth most indebted in the EU.
Household net worth stood at €712bn in Q3 2017, or €148,655 per capita. This was just 1% lower than the previous peak in Q2 2007, and is largely due to the recovery in property prices.
Residential Property
Residential property is the sector under most pressure, and this has been the case ever since the economy started to recover. There were 48,111 homes sold in 2016 which was actually lower than the 48,248 sold in 2015, in a situation of very short supply.
Sales strengthened to 51,688 in 2017 (up 7%), the highest level since the recession. Transactions are up by a further 5% in the first months of 2018, suggesting a final figure of about 55,000 for the year. This is a 300% increase since 2011 when just 18,400 properties were sold.
This increase in sales has occurred in spite of a lack of stock; there were just 18,900 properties for sale in December 2017, or 1% of the national housing stock of 2 million homes. This is being expanded, however, by an increase in the number of new homes being built, estimated at 19,000 last year, and expected to be about 21,000 this year.
Car Sales
Car sales began to recover in 2014 and grew strongly until 2016 when 142,688 were sold. Sales weakened in 2017, down 11% year-on-year, for a total of 127,045. This trend is persisting in 2018 with new car sales down -4% in the first quarter for a total of 58,402.
In contrast, there has been a dramatic rise in the number of imported second hand cars, up 47% in 2016, and up by 46% in 2017 for a total of 92,508. This trend is continuing in 2018, with imports up 8% in the first quarter. At this rate, imports should reach 100,000 for the year, a new record. This reflects the weakening of sterling which makes imports better value.
Taken together, car sales in 2017 were up 3.5%, which is reasonably healthy, and look like maintaining this level for 2018 rather than showing much growth.
Retail Spending
Retail sales were strong in 2017, up 4.3% for the year in volume terms, and up 2% in value. Growth accelerated as the year progressed, to a level of 7% in Q4, suggesting strong momentum into 2018. This equated to spending of €40 billion which is back to the levels seen in the last boom. Vat returns were also very strong, up by 7% in 2017 for a total of €13 billion.
Retail sales excluding the motor trade grew by 4.3% in volume in Q1 2018 and by 2% in value, year-on-year, despite the exceptionally bad weather conditions over that period. Retail sub-categories had mixed fortunes, with some up and others down in Q1. Household equipment continued to be the fastest growing category, up 10.2% in volume and 2.6% in value, year-on-year. Supermarkets and other food stores performed well but most other categories did badly, reverting to negative trends that haven’t been seen for several years.
- Food sales up 5.2% in volume and up 3.9% in value;
- Non-specialised stores (supermarkets) up 5.7% in volume and 4.5% in value;
- Fuel down -1.7% in volume and -1.6% in value;
- Clothing, footwear & textiles up 2.2% in volume but down -1.0% in value;
- Household equipment up 10.2% in volume and 2.6% in value;
- Department stores up 4.9% in volume and 1.0% in value;
- Pharmaceuticals and cosmetics up 2.6% in volume but down 1.3% in value;
- Bar sales down -2.8% in volume and up -0.4% in value;
- Books, newspapers, stationery down -1.2% in volume but up 0.3% in value.
Discover our Rankings and Accreditations