The consumer economy has finally recovered from the “lost decade”
- Date: Mon, Feb 17, 2020
Share this article
Dublin, February 12, 2020: The latest Consumer Market Monitor (CMM), published today by the Marketing Institute of Ireland and UCD Michael Smurfit Graduate Business School shows that the Irish consumer economy has remained strong over the past three years despite a faltering in confidence due to widespread worries about a negative fallout from Brexit. In fact, a review of the last decade paints a very positive picture in which most measures of wealth and well-being are back to where they were at the last peak in 2007, according to Marketing Professor Mary Lambkin of UCD Michael Smurfit Graduate Business School, author of the report.
“More people at work, rising wages and the increasing value of homes are all contributing to the improvement of household finances, with the perception of increasing wealth leading to more spending,” said Tom Trainor, Chief Executive of the Marketing Institute of Ireland.
General Summary
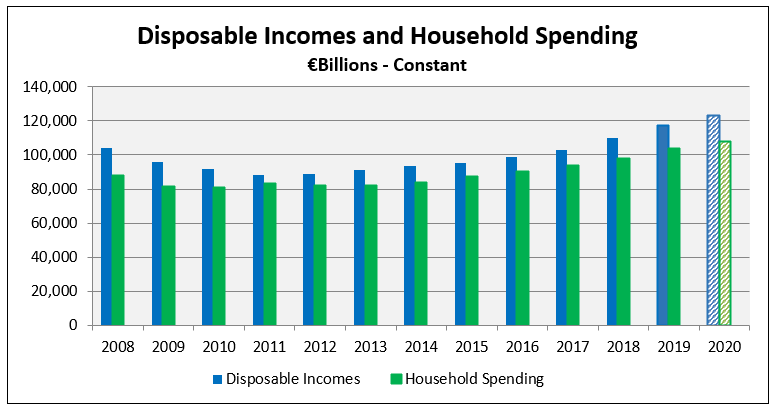
The Irish economy is continuing to grow strongly, with consumer spending providing the main stimulus together with property investment. Household spending grew by 3.4% in 2018 and by 3.3% in 2019, to a total of €108 billion, a strong performance that exceeded estimates.
Consumer demand is expected to remain strong this year and next year, driven by continuing growth in employment and incomes, but also helped by the removal of uncertainty in relation to Brexit.
There are now 2.33 million people at work, up 54,000 (2.4%) year-on-year, and up by 500,000 (28%) from the low point in 2012. Employment is expected to continue growing this year but at a moderating rate as the economy approaches full employment. Forecast growth of 1.5% in 2020 and 2021 will add another 70,000 people to the workforce.
Earnings growth has also played a part in recent years as wages have begun to rise. Wages increased by 2.5% per annum from 2015 to 2017, by 3.5% in 2018 and 2019, and are forecast to rise 4% this year and next, as the labour market tightens.
The combination of more people at work and higher wages has led to substantial increases in the amount of disposable income circulating in the economy. Aggregate disposable income increased by 5% a year from 2015 to 2017 and by 6% in 2018 and 2019, amounting to €117 billion for the year. This momentum is continuing in 2020 although forecasters suggest some moderation as employment growth slows. Growth of even 3% would lead to aggregate disposable income of €120 billion for this year.
Consumer spending has also been boosted by improving household finances, mainly as a result of the increasing value of peoples’ homes. Household wealth stood at €800 billion in September 2019, equivalent to €470,000 per household or €163,000 per person. This is up 80% from the lowest point in 2012. Perceptions of increasing wealth build confidence and encourage consumers to release some of that wealth for spending.
Irish consumers are also beginning to supplement their incomes by taking on some debt, mainly to support the purchase and furnishing of homes. Following a decade of deleveraging with repayments exceeding new borrowing every year, borrowing is beginning to increase again at a modest rate. New lending of €2 billion was advanced to Irish households in 2019, an increase of 2%. €1.2 billion of this was for the purchase of residential property with the balance for other personal consumption.
Credit and borrowing are not major contributors to recent spending, however, unlike in the last boom. The ratio of debt/disposable income of Irish households has continued to fall, down from 215% at the peak in 2012 to 115% in September 2019, a reduction of almost 50%. Also, savings are continuing to increase – bank deposits grew by almost €6 billion (+5.5%) in 2019.
An estimated 57,000 homes were sold in 2019 which was 4% higher than 2018. In contrast, the number of mortgages approved was up 7% in the year indicating that demand is still stronger than supply. 65% of those mortgages went to first time buyers showing that this is still the predominant need.
The market for cars is the most troubled sector right now; sales of new cars were down by -6.5% in 2019 to a total of 113,305. This continues the negative trend of the previous two years, with sales down -10.5% in 2017 and -4.6% in 2018.
In contrast, the number of imported used cars has been increasing every year since 2005, with sales of 109,000 in 2019, almost equalling new car sales.
In sum, car registrations have been more or less static for the past three years at about 220,000 per annum (222,000 in 2019). This compares to a total of 240,000 in 2007, of which 180,745 (75%) were new cars.
A final point to note is the broad-based deterioration in the UK consumer economy on foot of Brexit. There has been a weakening in virtually every metric tracked in this monitor, from property to cars to retail and services from mid-2016 to the end of 2019. Recent data show that this negative trend may be easing, however, with more clarity around Brexit and a slight lift in the value of Sterling.
Consumer Confidence
Consumer confidence began to recover in 2013 and increased steadily for five years in response to positive economic data. By 2017, confidence among Irish consumers was well ahead of the previous peak in 2007 and was also significantly higher than that of our European neighbours.
Confidence dropped through 2018 reflecting continuing worries about the negative implications of a “hard Brexit”. This downward trend continued through 2019 and, by the end of the year, confidence here was only marginally higher than the UK and the wider EU. Confidence has picked up in January 2020, however, and the picture looks more promising for the rest of this year.
Consumer confidence in the UK has been consistently negative since Q2 2016, reaching a low of -14 in November 2019. It picked up slightly in December (-11), however, and again in January 2020 (-9), suggesting that the tide may be turning now that Brexit has actually happened.
Consumer confidence in the EU has also been relatively weak for several years although slightly stronger than the UK (-8).
Consumer Incomes and Spending
The disposable income of Irish households rose by 6% in 2018 to a total of €110 billion, significantly overtaking the last peak of €101 billion in 2007. Increasing numbers in employment together with pay increases drove this growth.
Disposable income grew by a further 6% in 2019 reaching an estimated €117 billion for the year as a whole and the momentum is continuing this year, although perhaps at a slowing rate.
There are now 2.33 million people at work, up 55,000 (2.4%) year-on-year, and up by 500,000 or 28% from the low in 2012. Growth is expected to continue this year and next, but at a slightly lower rate of 1.7% and 1.5%, but this will add another 70,000 people to the workforce.
Earnings growth has also played a significant role in recent years; wages increased by about 2.5% per annum from 2015 to 2017, and by 3.5% in 2018 and 2019. Average weekly earnings stood at €768 last year, equivalent to annual pay of €40,000.
Household wealth has also recovered well from the recession, standing at €800 billion in 2019, €470,000 per household or €163,000 per person. This is up by 80% from the trough of €430 billion in Q2 2012.
Personal consumer spending grew by 3.4% in 2018 to €105 billion, and this positive trend continued in 2019 with spending up by 3% to a total of €108 billion. Consumer spending is forecast to grow by a slightly lower rate this year, of 2.7%, to about €111 billion, and by a further 2.4% in 2021.
Consumer Borrowing
Borrowing by Irish households grew at a record level from 2000 onwards and peaked in 2008 at €150 billion. It then declined steadily -- down 40% by December 2016 to €88 billion. This downward trend levelled off in 2017, after almost a decade, the first sign of a return to normal conditions. Household debt increased by 2% per annum in the last two years and stood at €92 billion in December 2019.
Loans for house purchase, which account for 83% of all household loans, peaked in 2008 at €125 billion but reduced to a low of €73 billion by 2016, a cumulative decline of 40%. Mortgage lending has resumed growth since then, increasing by over €1 billion in 2018 (+1.4%) and by €1.5 billion in 2019 (1.6%).
Lending for other consumption accounts for 17% of total borrowing. This category peaked in 2008 at €30 billion but declined to €13 billion by mid-2016, a reduction of 60%. It resumed growth in 2017 amounting to €15 billion by December 2019.
The indebtedness of Irish households is continuing to reduce; the ratio of debt/disposable income of Irish households has fallen from 215% in 2012 to 115% in September 2019, a reduction of almost 50%. Household deposits also have continued to grow, up by €6 billion or 5.5% in 2019.
Residential Property
There were 57,000 homes sold to private households in 2019, an increase of 4% on the 55,000 sold in 2018 which, in turn, was up 6% on the 52,000 sold in 2017. This seems a modest rate of growth with such a high level of demand for living accommodation.
There were 32,835 mortgages drawn down in 2019 which was 7% higher than the 30,630 in the previous year. 65% of those mortgages went to first time buyers demonstrating that this is still the predominant need.
New homes are playing an increasing part in fulfilling that need -- 10,300 were sold in 2018 compared to 8,800 in 2017. 20,000 new homes were completed in 2019 and housing starts rose to 26,000 suggesting a higher completion rate in 2020.
There were 1.24 million residential properties sold in the UK in 2016 but the market slowed to 1.2 million in 2017 and 2018. 2019 was weaker again, at 1.19 million but the market is expected to strengthen this year to about 1.21 million units.
Services
The services sector recovered more quickly from the recession than the retail sector, showing modest growth from 2011 onwards, and recovering more rapidly in recent years. The index overtook the 2007 peak in 2014, and made further gains in 2015, 2016, and 2017, up by 4+% per annum.
Services growth accelerated in 2018, up 8%, and this strength continued through 2019 which was up by 7% year-on-year, although it tapered off as the year unfolded (from 10.8% to 2%). This was closely matched by Vat returns which were up 7% in 2018 and by a further 6.2% in 2019 to a total of €15 billion.
The fortunes of individual service sectors have varied widely, however, information/communication services did best, up by an astonishing 28% in 2019. Other services were up by 12%, and accommodation and food service were also strong, up 3% and 9% respectively in 2019.
Car Sales
Following the recession, sales of new cars began to recover in 2014, and grew substantially in 2015 and 2016, to 143,000 units. This positive trend was short lived, however, reversing steadily since then.
Sales of new cars were down by -6.5% in 2019 to a total of 113,305. This continues the negative trend of the previous three years, with sales down -10.5% in 2017, by -4.6% in 2018.
In contrast, there has been a substantial increase in the number of imported used cars every year since 2005, with sales of 109,000 in 2019 almost equalling new car sales.
In sum, car registrations have been more or less static for the past three years at about 220,000 per annum (222,000 in 2019). This compares to a total of 240,000 in 2007 of which 180,745 were new cars.
Retail Spending
Retail sales (excluding the motor trade) were strong in 2019, up by 4.3% in volume and 2.7% in value. This continued the positive trend from 2018 when sales were up by 3.7% in volume and 2.7% in value but was lower than 2017 (+5.8% in volume and +3.5% in value). Sales revenue for 2019 amounted to €47 billion which was back to the levels last seen in 2007.
Online sales represented just 3.3% of total sales for traditional (bricks and mortar) retailers operating in Ireland, although it was higher in some categories such as books (13.5%). This does not include online retail sales going to exclusively digital retailers (e.g. Amazon) which amounted to about 11% of total retail sales.
Household equipment continued to be the fastest growing category this year, up by 11% in volume and 4% in value in Q4, year-on-year. Sub-categories within that -- electrical goods and furnishings -- did exceptionally well, up by 12% and 7% respectively.
Supermarkets and other food stores also performed well, as did pharmaceuticals and cosmetics. Department stores and newsagents were the weakest categories in Q4, down by -2.7% and -4.5% in volume respectively.
- Food sales up 3.6% in volume and up 2.9% in value;
- Non-specialised stores (supermarkets) up 3.6% in volume and 3.0% in value;
- Household equipment up 10.8% in volume and 3.2% in value;
- Pharmaceuticals and cosmetics up 3.9% in volume and 1.6% in value;
- Clothing, footwear & textiles up 4.4% in volume and 1.9% in value;
- Motor trades up 5.7% in volume and 7.1% in value;
- Fuel down -0.4% and in volume and down by -1.8% in value;
- Bar sales up 4.0% in volume and 2.6% in value;
- Books, newspapers and stationery up 0.1% in volume and 1.9% in value;
- Department stores down -2.7% in volume but down -5.5% in value.
Discover our Rankings and Accreditations